

Net Dollar Retention (“NDR”) is typically defined as (today’s Annual Recurring Revenue (“ARR”) from the customers you had 12 months ago) divided by (the ARR of that same set of customers 12 months ago). It is a cohort-based metric and excludes ARR from new logos signed in the last 12 months. I’ve also seen this referred to as Dollar-based Net Expansion Rate and Dollar-based Net Retention Rate.
NDR informs how much annual growth, net of churn, came from your existing customer base. There are four key drivers capable of materially impacting this metric:
- Gross retention / churn
- Cross-sales
- Product penetration / adoption model price increase
- Price increases through volume or usage
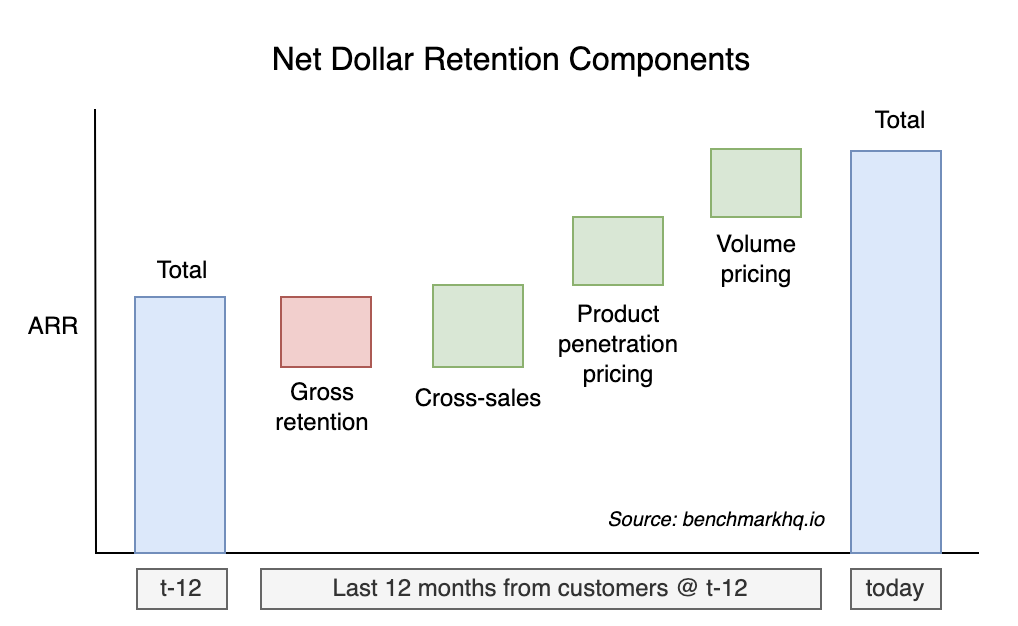
Gross retention quantifies customer churn and contraction, and helps you understand whether you have product-market-fit and how important your SaaS is to solving your customers problems. Of the four drivers, this is the most important component. Gross retention can drive your NDR to a max of 100% (i.e. we had 0 churn and contraction). Don’t focus on driving NDR until you are comfortable with your gross retention. For the purpose of this post, I’m going to assume you don’t have a churn problem and will focus instead on the other three drivers.
The other three components are what enable your NDR to surpass 100%. NDR of 100%+ means your customer base from 12 months ago is spending more with you today than they were then. How much more? 120% NDR means they’re spending 20% more. You can see, then, how NDR also helps you understand your customer lifetime value (“LTV”).
I believe the entire quantitative aspect of the SaaS business model can be reduced down to driving two key outcomes: (1) increasing LTV i.e. high output, and (2) doing so using the least amount of resources i.e. low input. Within that framework, I plotted the three net retention components:
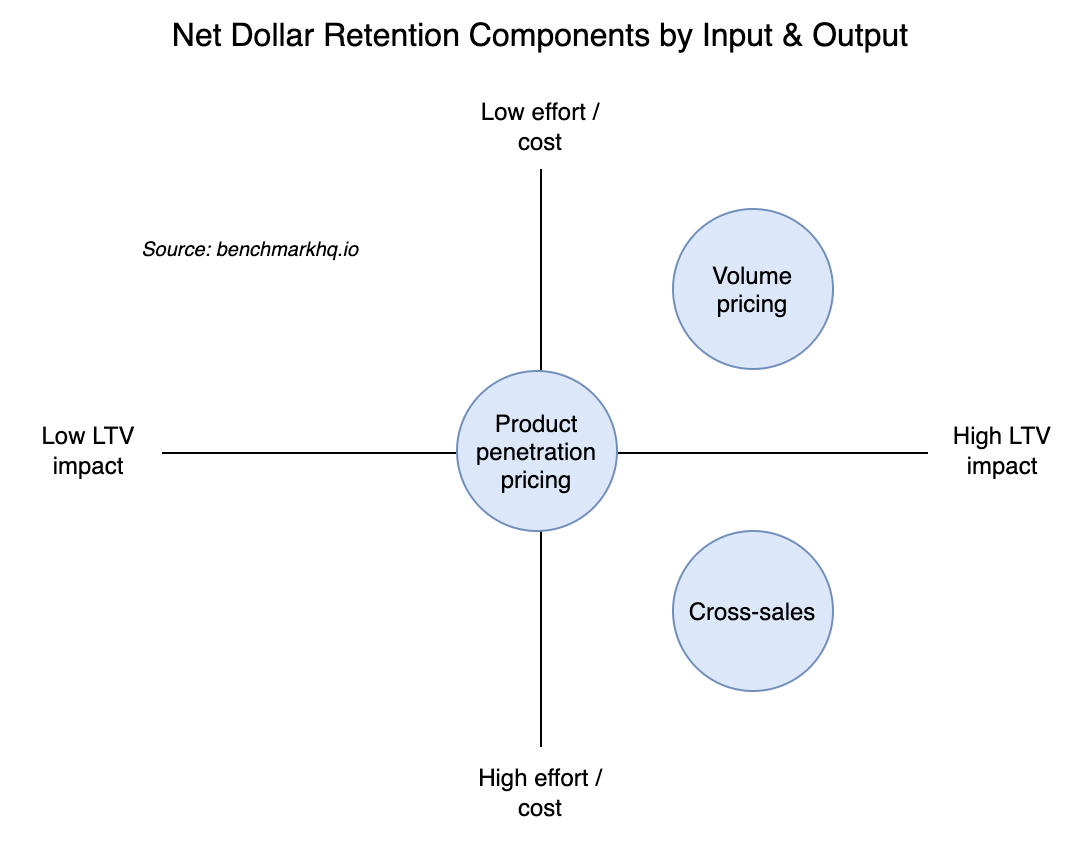
The X-axis is potential LTV impact from low to high. The Y-axis is the required resource consumption from low to high. Let’s explore each of these components.
Cross-sales
Cross-sales happen when you sell more products to your customers. Your ability to drive NDR from cross-sales tells you whether your roadmap is resonating with your customers. For example, ServiceNow started in IT service management and now generates 80% new ACV selling HR and Customer service management software back into their install base.
The impact of cross-sales on LTV is high. More products means higher ARR, which increases the numerator in your LTV formula. A customer using more products also solidifies your place as a vendor in their organization and increases your stickiness, thus reducing the churn rate in your LTV denominator. Finally, cross-sales acts as a multiplier on your ability to drive product penetration and volume pricing NDR.
While cross-sales produces high LTV, it also comes at a high cost. Building a new product and finding product-market-fit is expensive. Distributing that product through an enterprise sales team is also expensive.
Companies deploying a self-service or product-led-growth model incur less S&M costs. For these companies the cost is lower, although still in the high quadrant.
Product penetration / adoption model pricing
Product penetration happens when your customer buys more seats or uses your software for more use cases. There is a job that your customer is using your SaaS product to do. Product penetration means more instances of that job-to-be-done are being done by your product.
In other words, your product is adopted by more of your customer’s organization, thereby increasing job-to-be-done market share. This is more prevalent with bottoms-up adoption models. Think of more of your co-workers using Zoom to schedule meetings vs. your prior video conferencing software.
The LTV impact of product penetration is medium. I’m arguing that it is medium (vs. high) because once you achieve full penetration, this NDR well dries up. After every instance of the job-to-be-done is being carried out by your software, there isn’t anywhere left to go here. It’s finite, capped. Let’s consider Zoom again, they price per seat. Once the entire company is using Zoom video chat, product penetration ceases to be a NDR driver for that customer.
The cost of product penetration is also medium. The product is already built so there is less R&D cost. You still need effort to distribute, which may continue to happen bottoms-up, or you may have an enterprise sales motion coming in over the top. But both should be more cost effective as the customer is already seeing value from your product so the product does some of the remaining distribution work.
Volume pricing
Volume pricing enables you to participate in the amount of value that your product is providing to your customer. For example, Twilio prices based on the number of SMS sent, so Twilio’s ARR per customer increases as customers send more SMS. NDR driven by volume pricing is a result of value alignment between vendor and customer, shared skin in the game.
Unlike product penetration, NDR driven by volume pricing is not capped by functional adoption. It extends beyond job-to-be-done market share, into the volume of that job. Volume pricing can drive persistent NDR increases over time and therefore has a high potential impact on LTV. If your job-to-be-done grows with your customer’s growth, then you participate in the success, theoretically into perpetuity.
In the Twilio example, functional adoption is when all of a customer’s products are using Twilio for SMS. Twilio has 100% market share of SMS messages sent. Volume pricing is when the customer’s products send more SMS as they grow. Think Uber becoming more popular and sending more car arrival texts, thus increasing Twilio’s revenue.
Volume pricing is also the only NDR component with a low cost. In some cases, there is no cost. Aside from monitoring usage and ensuring the customer gets billed appropriately (which can be done systematically), the work required by the SaaS vendor is minimal.
As an operator you should understand NDR within the context of your business model
NDR is not one size fits all. While there are commonalities, your NDR quantifies aspects of your company’s business model. So as an operator it is important to understand that the NDR metric may mean something different for your business than the business next door. Why? Because the extent to which you deploy cross-sales, bottoms-up product penetration, and volume pricing will be unique to your business. I recommend tracking and reporting NDR by component:
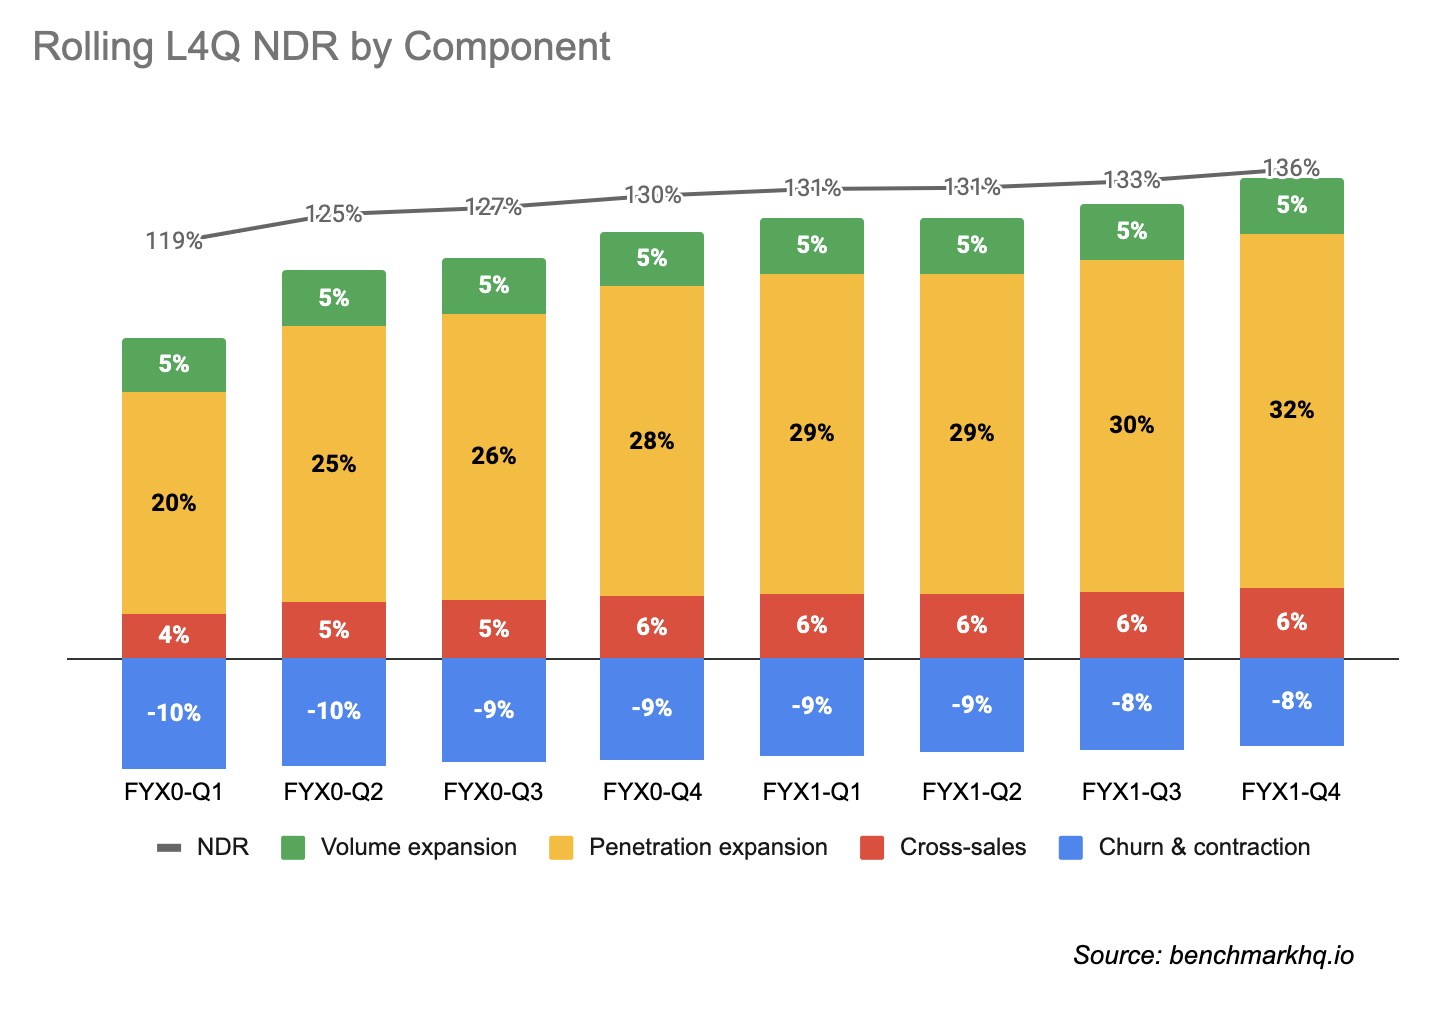
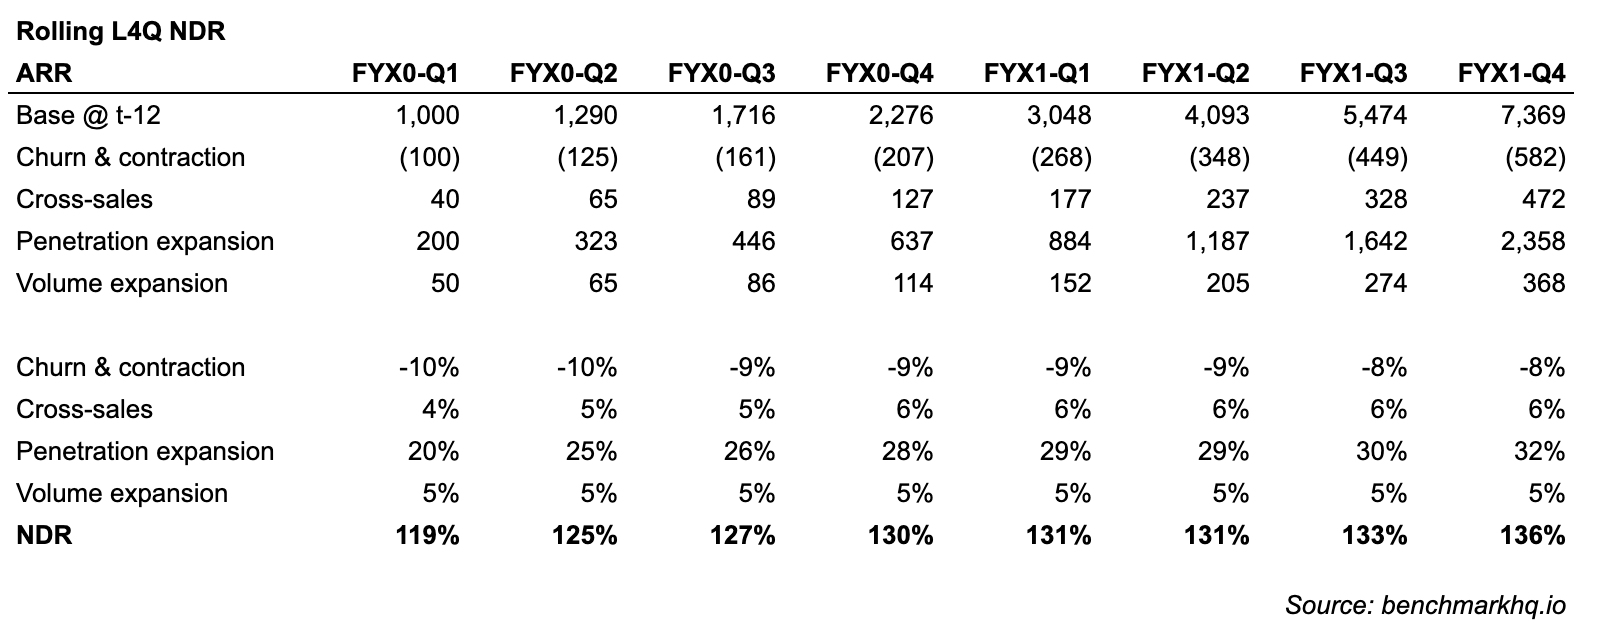
If I were to analyze my hypothetical company, I can see that the land & expand product penetration aspect of my business model is increasing my customer base by 32% annually. As a result I may conclude that my land & expand motion is working.
I also see that I’m not driving much NDR from cross-sales. That may be okay if my company hasn’t expanded beyond our core product yet. Alternatively that could be an area of concern if customers are not buying my company’s add-on products.
And finally, I can see that volume pricing is not a big part of my pricing strategy today. But if we try and experiment with that, I can see the results here.
When I go to communicate my company’s NDR results, I’ll explain it within this context. The blended NDR metric primarily tells us how well our land & expand product penetration motion is working, and that you can see the component breakdown.
Not all NDR is created equal
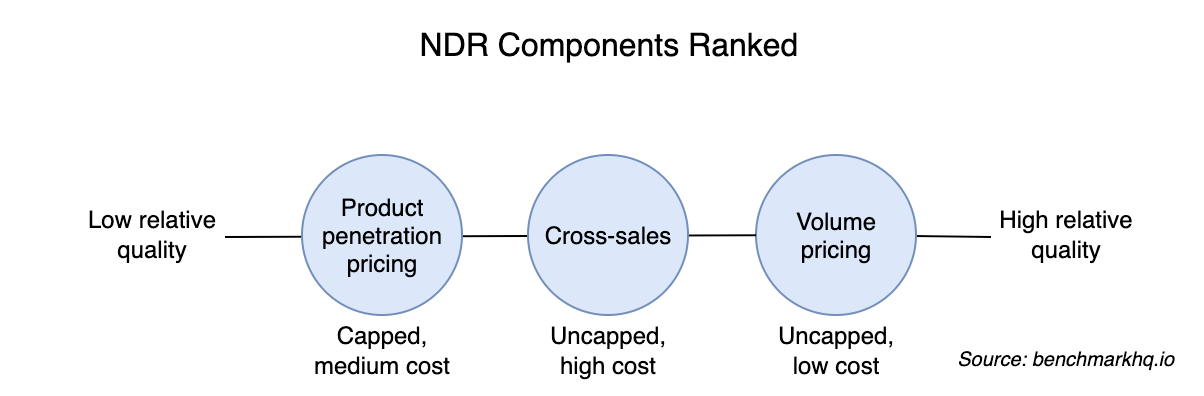
Any increase in customer ARR (and thus NDR) driven by product penetration, cross-sales, or volume pricing is a positive. But the combination of resource requirement and resulting LTV impact means that some NDR components are more valuable and higher quality than others. I rank the quality of NDR by component below. The primary factor in my ranking is the ability to impact LTV, and whether that impact is capped or uncapped. The secondary factor is cost.
Both volume pricing and cross-sales enable uncapped LTV growth, while product penetration LTV growth is capped. Therefore I would argue that volume pricing (uncapped LTV impact, lowest cost) is the highest quality NDR driver while product penetration (capped LTV impact, medium cost) is the lowest quality NDR driver.
Bottoms-up vs. tops down
The finite nature of product penetration LTV begs the question, if given the choice of a bottoms-up land & expand adoption motion that is accompanied by high NDR, or a tops-down adoption motion at the cost of lower NDR, which would you choose?
This topic is worthy of its own post, but I’ll answer here in the context of NDR. From strictly an LTV perspective (ignoring sales friction which is of course a key factor), your goal is for your product to have 100% market share of the job-to-be-done, i.e. full customer penetration. Product penetration through land & expand is a means to achieving this end. And in this case NDR quantifies the rate at which you’re driving to the end.
Compared to a land & expand adoption motion, a tops-down distribution motion achieves product penetration as part of the initial sales cycle. NDR is typically lower, but that is because you’ve pulled forward to today what would have been years of ARR expansion.
So all else equal a tops-down motion at the cost of NDR has a stronger impact on your customer LTV. It also enables you to focus more effort on driving uncapped, higher quality NDR from cross-sales and volume pricing. There are of course other trade-offs I’m not discussing here.
NDR and equity markets
I saw this chart from Software Equity Group the other day. The public and private equity markets are very interested in NDR, and as you can see high NDR correlates with high valuation. Note that adding more SaaS companies reduces the R2 so it may not be a valuation driver.

I’m not surprised that Twilio is driving the highest NDR. And I would argue has the highest quality, most sustainable NDR. They’re one of the few public companies as of writing this who drives NDR through all three components: cross-sales, product penetration, and volume pricing. I’d like to see a breakdown of their NDR, but I expect volume pricing is a key contributor.
Most of the companies in the above chart with 120%+ NDR have land & expand business models and are driving NDR through product penetration. And as we now know, as the product adoption well dries up, continuing to drive NDR at these levels becomes dependent on their ability to successfully bring new products to market. This is not a criticism. The bottoms-up land & expand motion works, it’s a great business model. But NDR from this business motion is finite.
It’s unclear whether the public understands this point. The fact that charts like the above are being published which compares apples & oranges business models and therefore NDR metrics to each other suggests there is still some learning to be done.
Photo by Daniel von Appen on Unsplash
